Trending Plot Configuration
Generating Plots via the Confiuration Panel
The trending plots allow the user to view variations of properties of the detector individually or many at once. The initial configuration must define the properies allowed in such plots.
!!! tip "It is possible to allow customization based on user commands, should the developers' configuration of trends allow customization options.
The below steps are to configure trends to allow 2 properties in a plot.
-
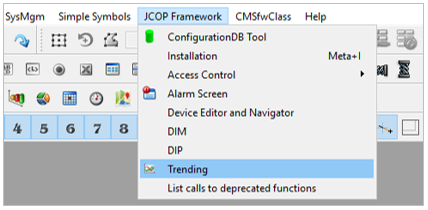
Hover over the tab "JCOP Framework" and click on the "Trending" option from the dropdown menu.
-
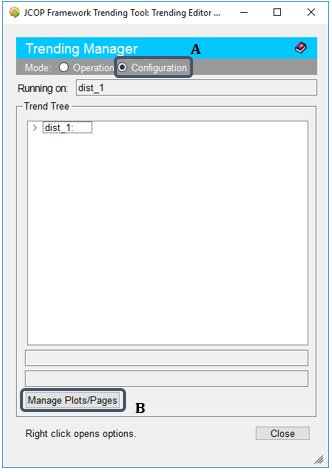
Move to the 'Configuration Mode' (A) of the 'Trending Manager' popup panel and click on the "Manage Plots / Pages" button (B).
The resulting panel presents current configurations of the system in the tabular section, filter section and a section to define new configurations.
The first column of the table "Page / Plot Data Point Name" is the DP name of the configured selected based upon developer's preference, not the original DP name.
By double clicking on an existing configuration, it is possible to get the "Plot Configuration" panel for the selected configuration.
-
Move to the 'Create New Page / Plot' section, select the relevant option from the dropdown menu and click on the "Create" button.
In most cases the preferred option is to configure plots with resepect to time, if that is the case, select "Trending Plot (Value Over Time)" option.
-
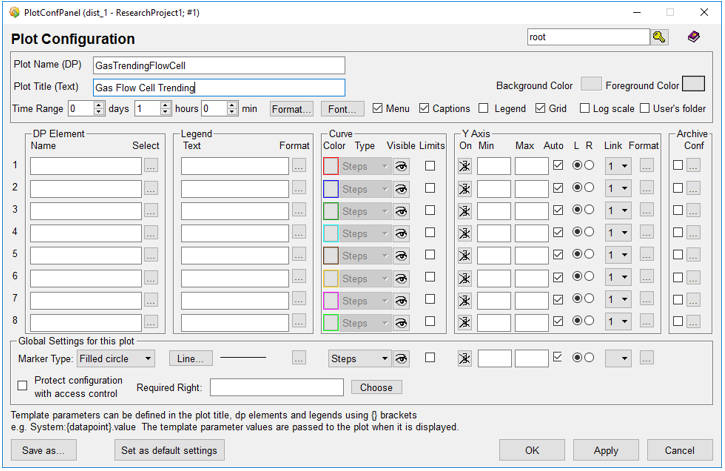
In the 'Plot Configuration' panel, fill in the fields 'Plot Name (DP)', 'Plot Title (Text)', set time range specifications nd check relevant boxes for required features.
-
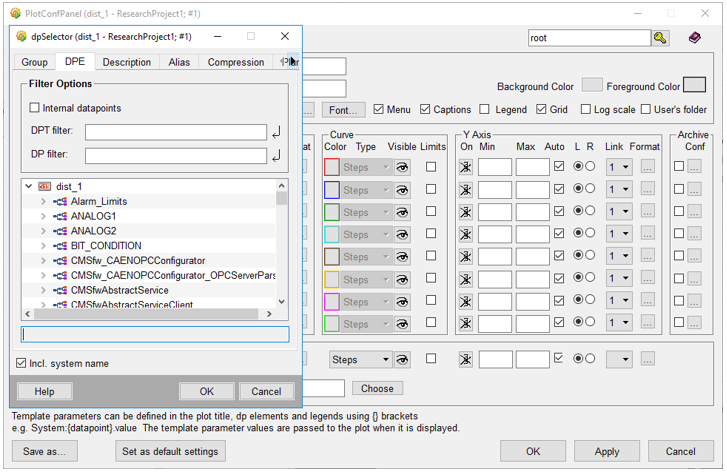
Move to the first column to define the DP, click on the options box under 'Select' which automatically opens the 'dpSelector' dialog box and select the required DP from the list. Similarly include all other DPs.
It is recommended to include a $parameter as the first part of the DP, which could simply be edited by clicking on the name.
-
Move to the second column to format legend texts, which would be on the canvas of the plot of the final trending panel.
-
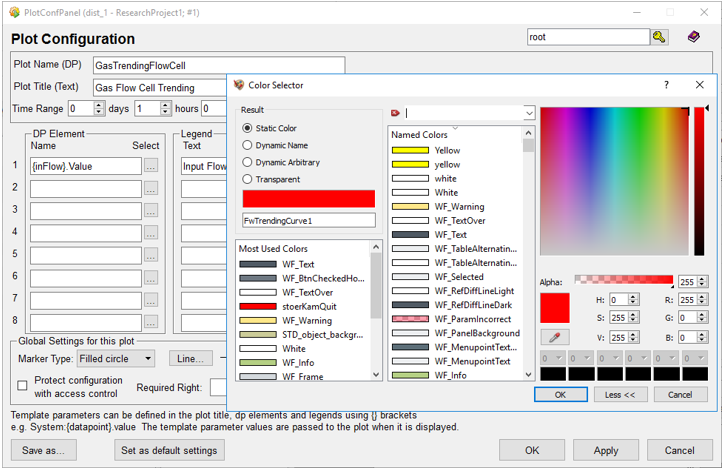
The third column presents color specifications for legend, where default colors are visible for variables.
It is possible to select an alternate color option preferred by the developer through a list of colors accessed via the options box.
-
Move to the fourth column for Y axis coniguration.
In order to be visible on the canvas, axis should be in an ON state, the range could be defined by introducing Min and Max limits, and provide the side of appearance by clicking on L or R radio buttons.
If defined Y axes are linked together, rescaling and formatting of such nature would automatically be applied to all linked axes.
-
If all configurtions are defined according to the requirements, click on the "Apply" buttons, and then click the "Ok" button.
If the creation was successful, the created configuration should be visible in the tabular area.
Linking the Configured Plot with the Panel
The linking of the configured plot DPs and the actual panel is done by employing the script that calls the panel in response to a click on a button or a link.
Move to the relevant panel and double click on the script of the event 'Clicked' available in the 'Property Editor' section of WinCC OA interface.
Then modify the script accordingly,
Employing the reference panel 'refTrendPage' for multiple plot presentations and 'refTrendPageSingle' for single plot presentations created in GEM DCS for trending plots.
fwTrending_addFaceplate(moduleName(),"_",refName,plotDpName,parameterName,paramenterValues,x,y,exceptionInfo,xScale,yScale)
moduleName: module on which the faceplate should be addedrefName: reference name of the new symbol to be addedplotDpName: plot DP to use for configuration of the faceplateparameterName: list of parameters to be passedparamenterValues: list of values for parameterNamesx,y: x or y position of the panel to add symbolxScale,yScale: (optional) scaling factor
Saving the Configured DPs of the Trending Panel
-
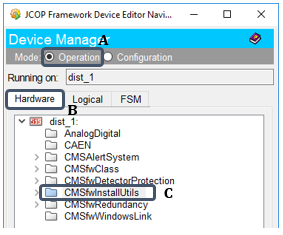
Shift to the 'Operation Mode' (A) of the 'Device Editor and Navigator' panel and move to the 'Hardware' tab (B).
-
Click on the "CMSfwInstallUtils" option (C) and wait for the Install Utils panel to open.
-
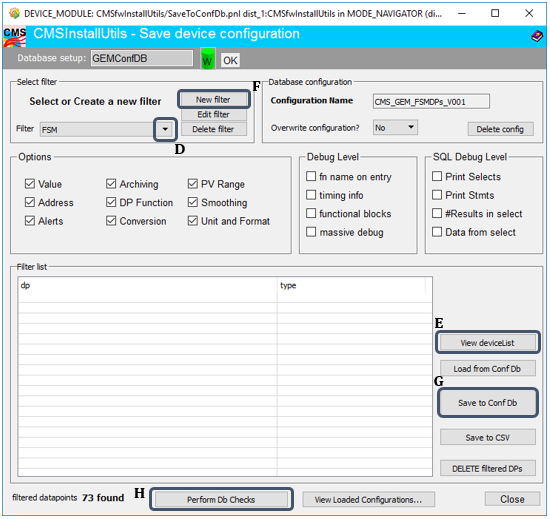
Click on the downward arrow in the 'Select Filter' section (D), select the option "Trending" and click on the "View Device List" button (E).
-
Check if the new configuration appears in the tabular area, if not proceed with below steps to see the configuration.
-
Click on the "New Filter" button (F) and update the version of configuration in the field of 'Device Config Name' in the 'Create or Edit Filters' panel.
-
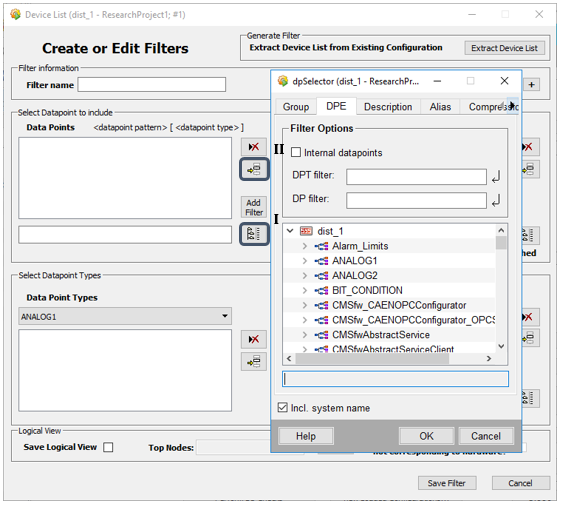
Click on the button (I), select the DP list from the 'dpSelect' popup panel, click on the button (II) and save the configuration by clicking on "Save Filter" button.
-
Repeat the steps 3 and 4 to check if the newly created and saved configuration appears.
-
If it appears then click the "Save to ConfigDB" button (G) and perform a database check by clicking on the "Perform DB Checks" button (H).
When performing a database check use the test option "Show All" by checking the box and then clicking on the "Perform Analysis" button.
Click on the option "All" and click on the "Analyze Config" button to compare all datapoints.
-
Save the new configured version of the system to the central DCS employing the 'Component Handler' referring the "Adding DCS Components to the cDCS" section.
Do not edit, instead create a new version of the component.
