Gas Interface
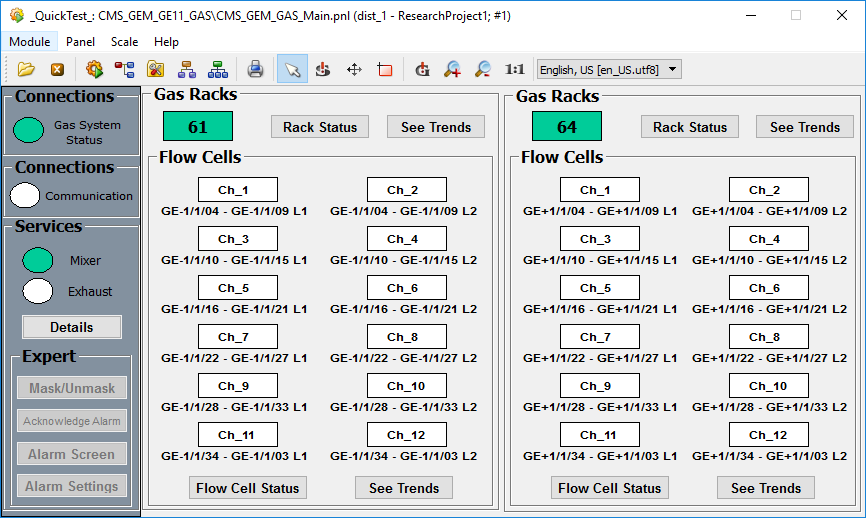
The ‘Gas’ tab results on an interface in the screening area of the DCS main interface and provides information on Gas Mixer status, Gas Rack status and Gas Channel status.
Services Mode
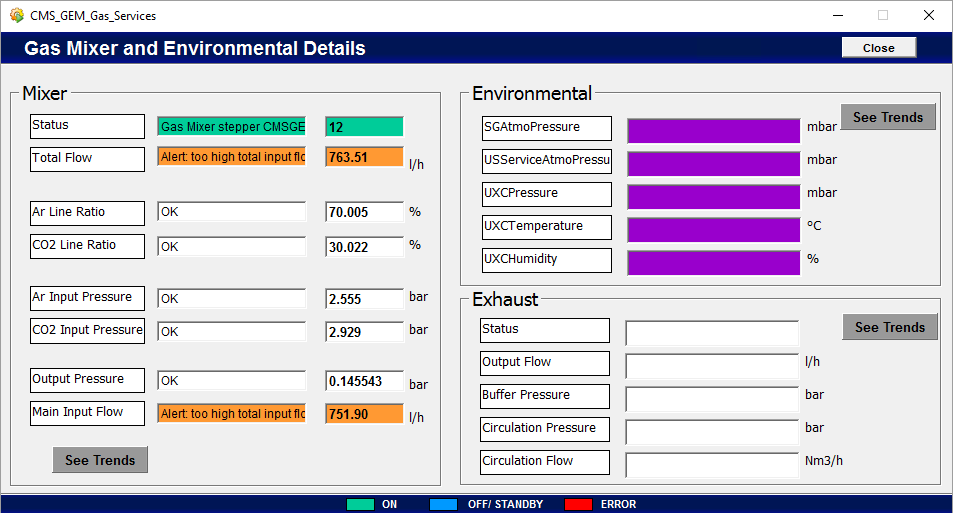
The indicators available are ‘Mixer’ and ‘Exhaust’ and provide system status following alarm status. A single click on the "Details" button with an active indicator option will provide the following panel.
Each section presents information on several important parameters for monitoring purposes i.e. gas percentages, input flow, pressure, environmental parameters etc.
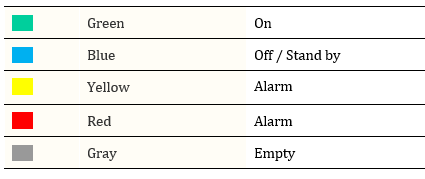
The values in the cells are expected to be consistent with a defined range and depending on the consistency the cell area with value will take a color.
Color Code
In addition there are a few buttons designed for trends given below.
Mixer Trends
This panel is used to view mixer trends such as the percentages of Ar, CO2 and CF4 gases along with their relevant pressures.
Exhaust Trends
Content has not been updated yet.
Environmental Trends
This panel is used to view environmental trends such as the pressure, atmospheric pressure, temperature and humidity.
In the trending plot a single click on a plot area provides a table with quantitative information in that particular time instant.
Gas Racks
The section for Gas Racks in the main panel provides system status and trends. The square indicator presents the general status of the rack and the number written on it is the real number of the included gas rack.
Status Panel
A single click on the "Rack Status" button will result in the following panel.

The panel presents information on input pressures, pressure from the regulator etc. in the form of actual values of mentioned variables associated with gas racks.
See Trends Panel
By clicking on the "See Trends" button in the status panel or in the main interface within the 'Gas Racks' section the trends panel will appear for selected gas racks.
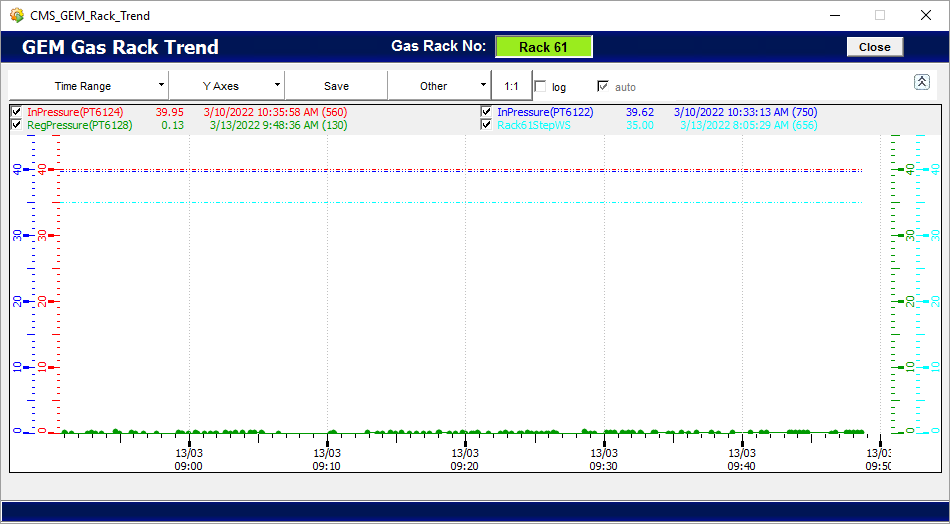
This panel is used to view Gas Rack trends such as the input pressure, regulator pressure etc. in a graphical format.
In the trending plot a single click on a plot area provides a table with quantitative information in that particular time instant.
Flow Cells
Each rectangle represents a single channel with input and output flow cells. The color is related to the alarm system and is defined by 2 base elements.
- Status of input flow
- Status of the difference between the input and output flows
Color Code
Status Panel
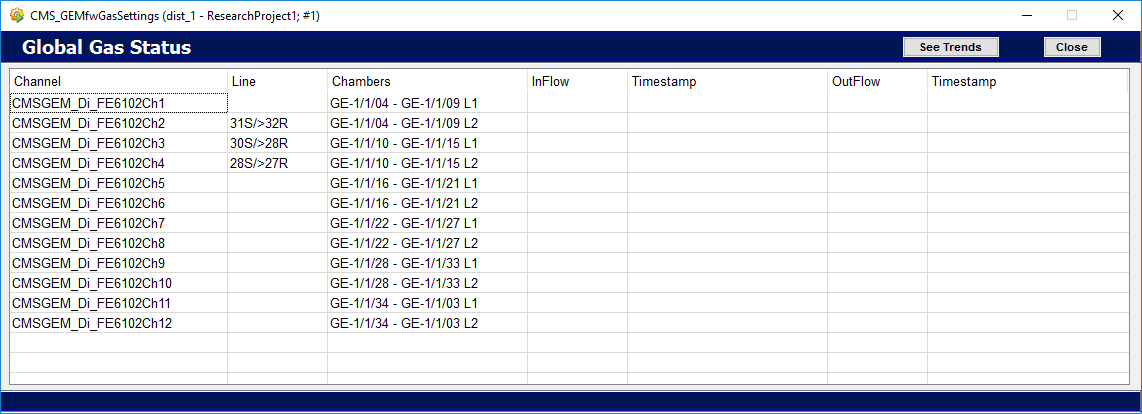
A single click on the "Flow Cell Status" button will result in the following popup panel.
The panel on Flow Cell settings presents information on input and output flows with timestamps based on the channels in the main panels.
See Trends Panel
Clicking on the "See Trends" button in the status panel or in the main interface within the 'Flow Cells' section will result in a graphical representation of Flow Cell gas trends.
First set of plots represents flow channels 1 through 3 and the second set represents flow channels 4 through 6.
Expert Mode
Only experts are given the privilege to change settings. Experts can mask, unmask and acknowledge alarms settings in addition to other privileges concerning alarms related to the gas system.
Following panels allow the experts, system appropriate alarm handling.
- Mask/Unmask Variables Panel
- Acknowledge Alarm Panel
- Alarm Screen Panel
- Alarm Set Panel
