Generating Plots
Generating and Customizing Plots via DCS Panels
Generating Plots
Plots for DP values collected during a given time interval can be generated simply clicking on the buttons named as "Show Trends" or "Trending Plots". Following information are to customize such plots.
Customizing Plots
Customizing the plot is done by employing the options available in the horizontal menu bar in the plotting region of the selected trend. Refer the details below for more information.
-
The "Time Range" dropdown menu is employed to define the interval to plot, which can be selected by ticking on avaliable options in the list or via 'Specify a Time Range' option.
-
The "Y Axes" dropdown menu presents all zoom in and zoom out options available for the user to apply as preferred.
-
The "Save" dropdown menu provides the user with a series of options to save trending plots, should the user expects to save accessible plots for later use.
-
The "Other" dropdown menu presents the options such as X axes adjustments etc. for the better visualization of plots.
-
The "Log" check box and the "Auto" check box, present the option to view plots in a log scale or a normal scale.
In addition to above customization options, within the region of the plotting canvas there are more options designed for the ease of trend visualization.
-
The "Legend" region is simply presented as a color based legend and automatically appears with a plot. The user has the ability to remove a certain entry class by simply unchecking the relevant check box.
-
"Reading Point Values" is possible with a simple click on a data point in the plot. This will pop a movable vertical cursor and a table presenting values along the vertical cursor.
-
Along with each collected data point comes a "Time Stamp" and the X axis represents date and time.
Generating and Customizing Plots via CMS Online
Generating Plots
Plots for DP values collected during a given time interval can be generated by following the steps below through the DPs and values available in the CMS Online repository.
-
Visit the repository for CERN via https://cmsonline.cern.ch using CERN credentials.
-
Click on the "WinCC OA" (III) option of "DCS" (II) from the left sidebar under "Common" (I).
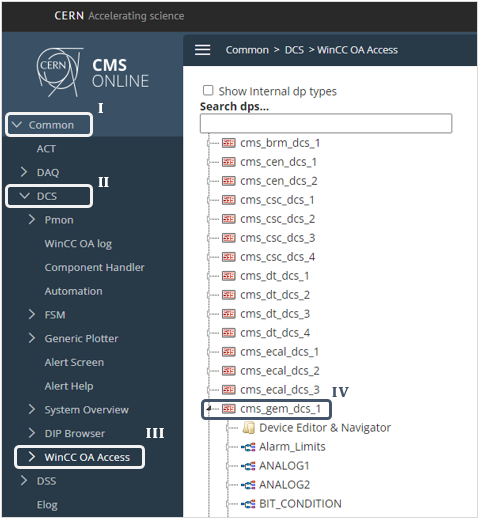
-
Select the GEM project "cms_gem_dcs_1" (IV) from the list and expand it by clicking on the arrow head.
-
Expand the DP cache of the required DP, in order to get data values collected via DAQ in its process and from the list select the required option and click on the DPE name.
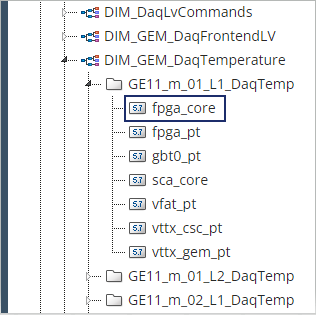
The expanded list contains DPs and are sorted in an order, most likely layer-wise for each Super Chamber of each End Cap. In such casesm the naming convention is as Project_EndCap_SuperChamberNumber_Layer_DPname.
-
Wait until the gray background area in the left hand side of the screen provide the the information section and click on the link "Open Plot".
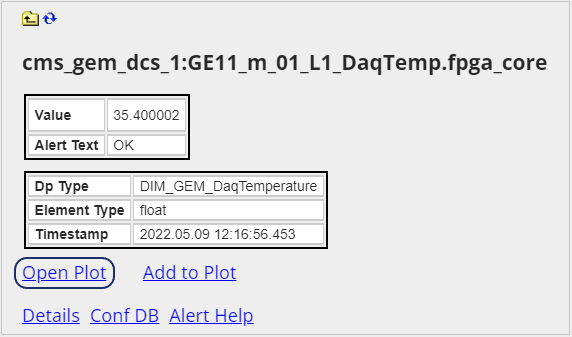
-
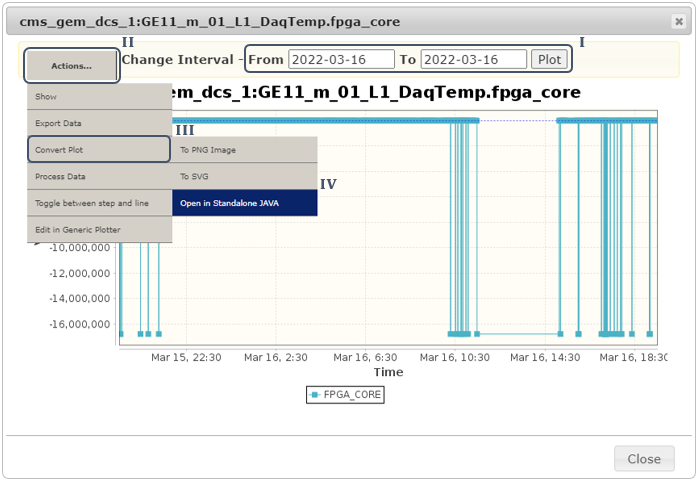
Check if the below panel with the selected plot appears.
Customizing Plots
There are many customizing options available for users, in the options presented by the "Actions" button for visualize, save, convert and export data in the plot. Below are the most common options used in cutomizing trends, follow the steps to ensure the proper setting of a time range and zooming options.
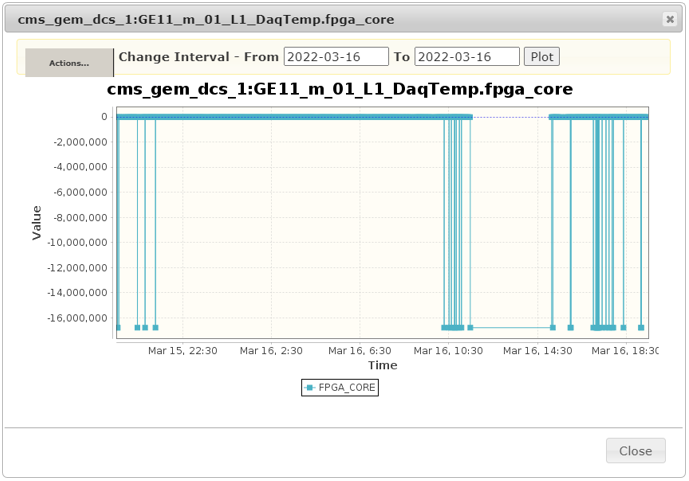
-
If the adjustments to the "Time Range" for the plot are required, change the time interval to the duration that is expected in the plot and click on the "Plot" button (I).
-
If "Zoom Actions" are required (zoomin, zoom out, etc.) follwo the steps below.
-
Hover over the "Actions" button (II), select the 'Convert Plot' option (III) and click on 'Open in Standalone JAVA' option (IV).
-
Follow the procedure in the popup panel and click on the
Download the json file to your pcand confirm to save the file to a destination.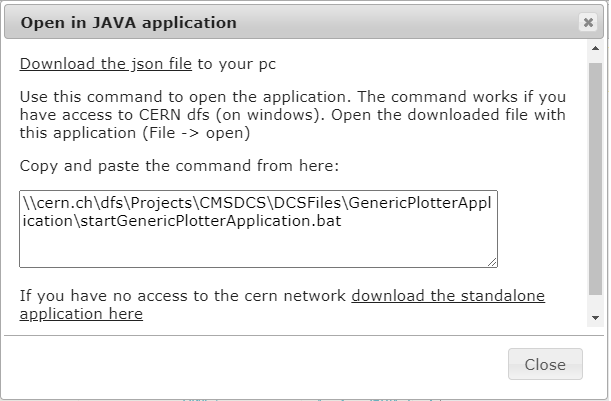
-
Copy the path in the text area under
Copy and paste the command from here:, paste it in a command prompt and wait a few seconds until the process ends.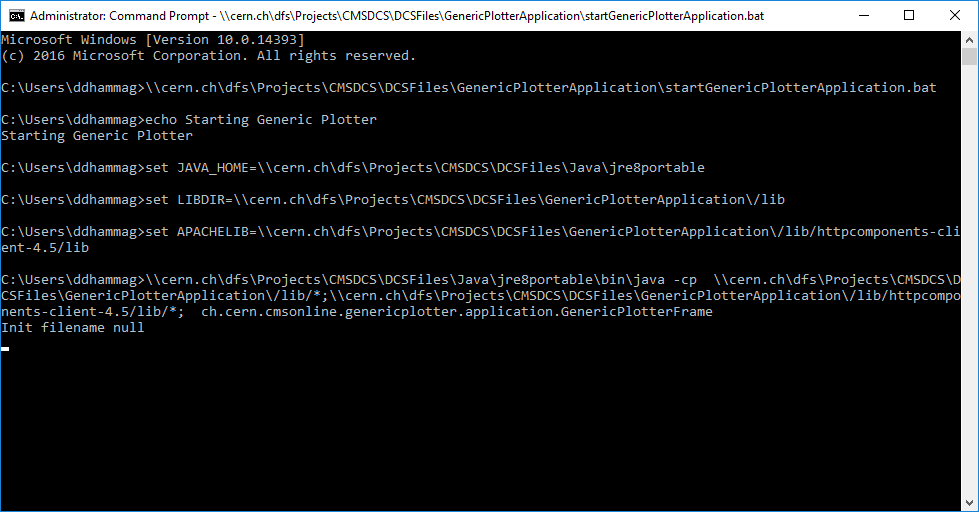
-
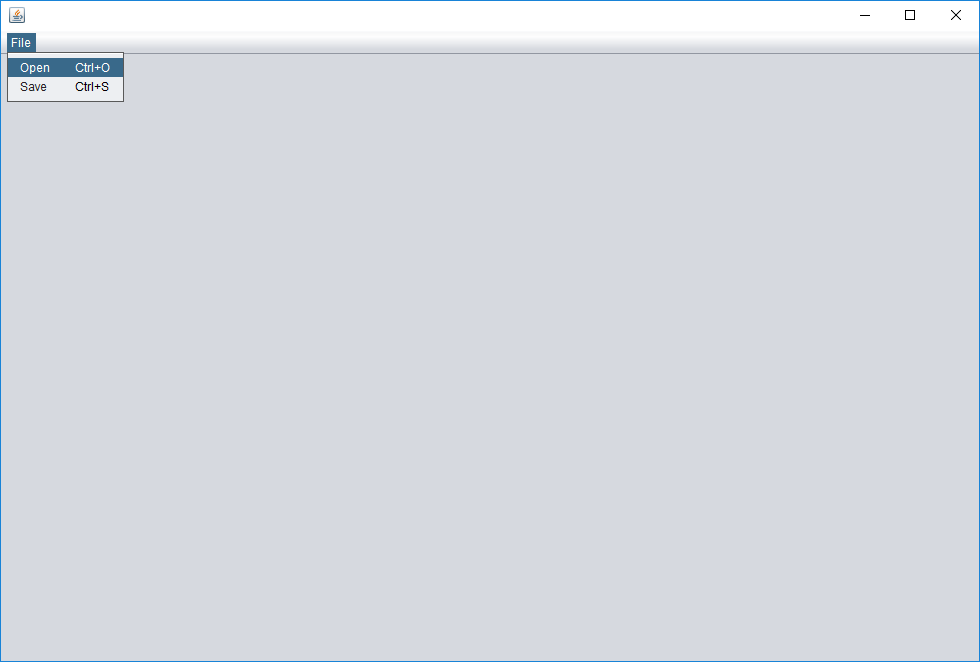
In the blank Generic Plotter java panel that appears, click on the 'File' tab in the header section, select the 'Open' option.
-
Select the downloaded file from the destination and load it which will then allow the user to perform actions as required.
-